Welcome to qulacsvis’s documentation!
qulacs-visualizer is a quantum circuit drawing library for qulacs. This library only supports Python. Not available in C/C++.
Installation
Install using pip from PyPI:
pip install qulacsvis
Example
For more information, see the documentation of the circuit_drawer() function. The documentation describes the other options available.
Or See also How to use options.
Text-Based Drawing
In text-based mode, draws the circuit as ASCII art. This mode is the default behavior.
>>> from qulacs import QuantumCircuit
>>> from qulacsvis import circuit_drawer
>>>
>>> # Build a quantum circuit
>>> circuit = QuantumCircuit(3)
>>> circuit.add_X_gate(0)
>>> circuit.add_Y_gate(1)
>>> circuit.add_Z_gate(2)
>>> circuit.add_dense_matrix_gate(
...     [0, 1], [[1, 0, 0, 0], [0, 1, 0, 0], [0, 0, 0, 1], [0, 0, 1, 0]]
... )
>>> circuit.add_CNOT_gate(2, 0)
>>> circuit.add_X_gate(2)
>>>
>>> circuit_drawer(circuit)
       ___     ___     ___
      | X |   |DeM|   |CX |
    --|   |---|   |---|   |----------
      |___|   |   |   |___|
       ___    |   |     |
      | Y |   |   |     |
    --|   |---|   |-----|------------
      |___|   |___|     |
       ___              |      ___
      | Z |             |     | X |
    --|   |-------------●-----|   |--
      |___|                   |___|
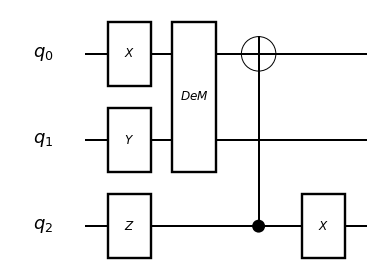
Matplotlib Drawing
To use another drawing method, you can specify it by setting a value to the output_method argument of the circuit_drawer() function. For matplotlib drawing, set output_method="mpl".
>>> import matplotlib.pyplot as plt
>>>
>>> circuit_drawer(circuit, "mpl")
>>> plt.show()
LaTeX Drawing
For LaTeX drawing, set output_method="latex".
>>> circuit_drawer(circuit, "latex")
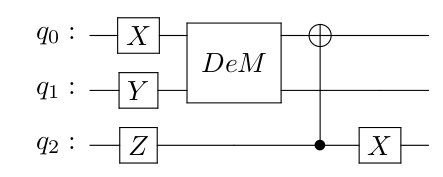
If you want to output LaTeX code, set output_method="latex_source".
>>> print(circuit_drawer(circuit, "latex_source"))
\documentclass[border={-2pt 5pt 5pt -7pt}]{standalone}
\usepackage[braket, qm]{qcircuit}
\usepackage{graphicx}

\begin{document}
    \Qcircuit @C=1.0em @R=0.7em @!R{ \\
        \nghost{ q_{0} : } & \lstick{ q_{0} : } & \gate{X} & \multigate{1}{DeM} & \targ & \qw & \qw\\
        \nghost{ q_{1} : } & \lstick{ q_{1} : } & \gate{Y} & \ghost{DeM} & \qw & \qw & \qw\\
        \nghost{ q_{2} : } & \lstick{ q_{2} : } & \gate{Z} & \qw & \ctrl{-2} & \gate{X} & \qw\\
    }
\end{document}
Requirement
If you want to use LaTeX for drawing, you need to have a local environment where you can run LaTeX (pdflatex). You will also need the qcircuit package. TeX Live and MiKTeX have the qcircuit package installed by default.
Save image to file
You can save the images you draw with matplotlib and LaTeX to a file.
>>> # matplotlib
>>> circuit_drawer(circuit, "mpl", filename="output.png")
>>>
>>> # latex
>>> circuit_drawer(circuit, "latex", filename="output.png")